Catalog
In order to overcome the hurdles of data collation, computation, analysis and visualization for disease similarity, a web server, DSNet, is implemented to facilitate the research in the field. Its detailed usage is as following:
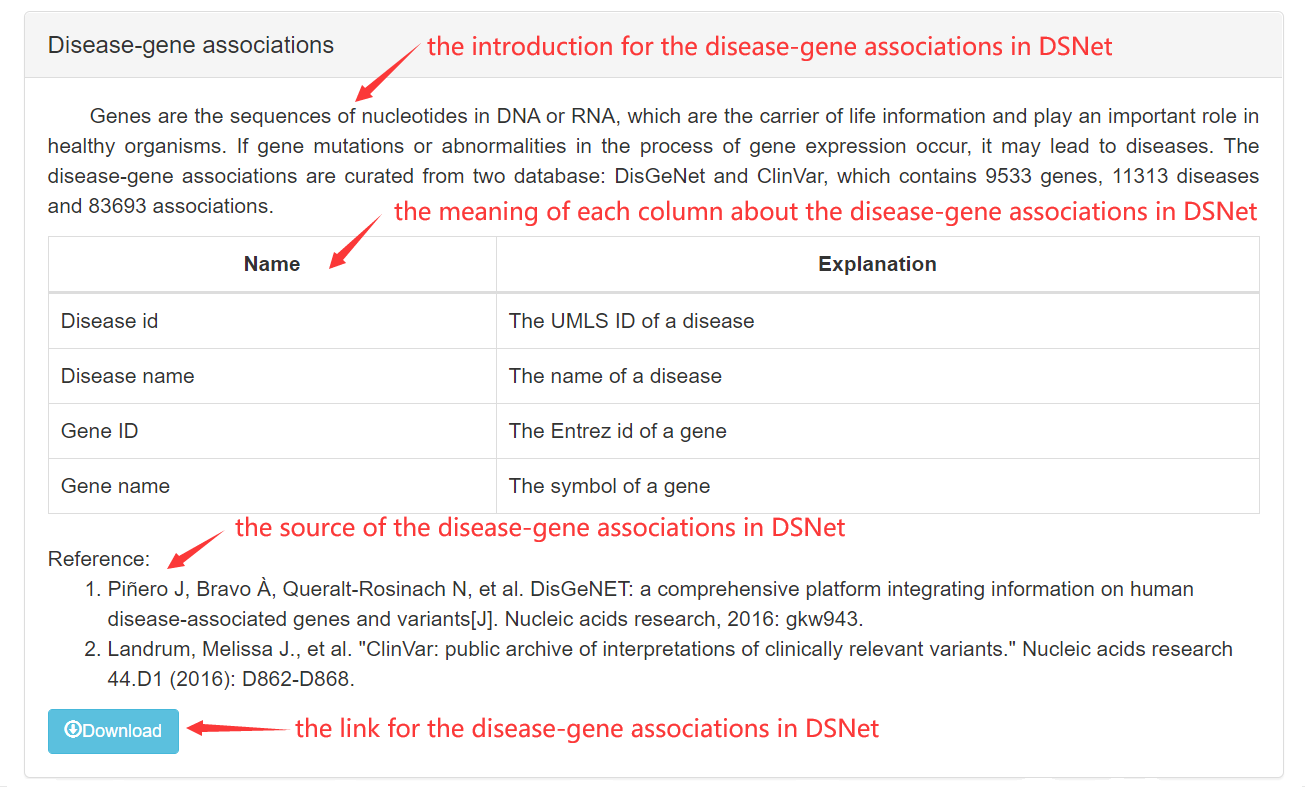
[1] To download associations related to diseases
Step 1: Get into "Associations" page from navigation bar on the top.

Step 2: Choose a type of association related to diseases. Take disease-gene associations for example.
[2] To compute the disease similarity
Step 1: Get into "Computation" page from navigation bar on the top.

In module of "Computation", DSNet contains three sections: existed results, on-line computation, off-line computation. DSNet has been collected disease similarity results of 20 computational approaches and lists them in the page of "existed results". If you want to compute the similarity among a small number of diseases, the "on-line computation" is a very suitable way. For thousands of diseases, it usually takes more time to calculate. So the R package, dSimer, and python package, "NetBasedDSim", in "off-line computation" page is a better choice.
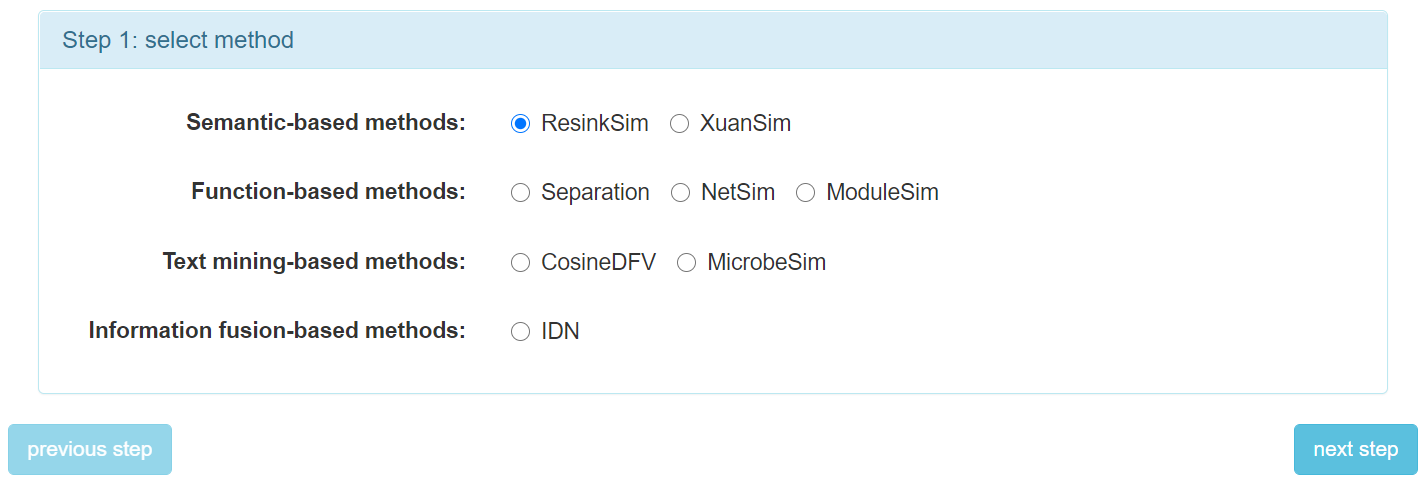
Step 2: When get into "on-line computation" page, the first step is to select a method.
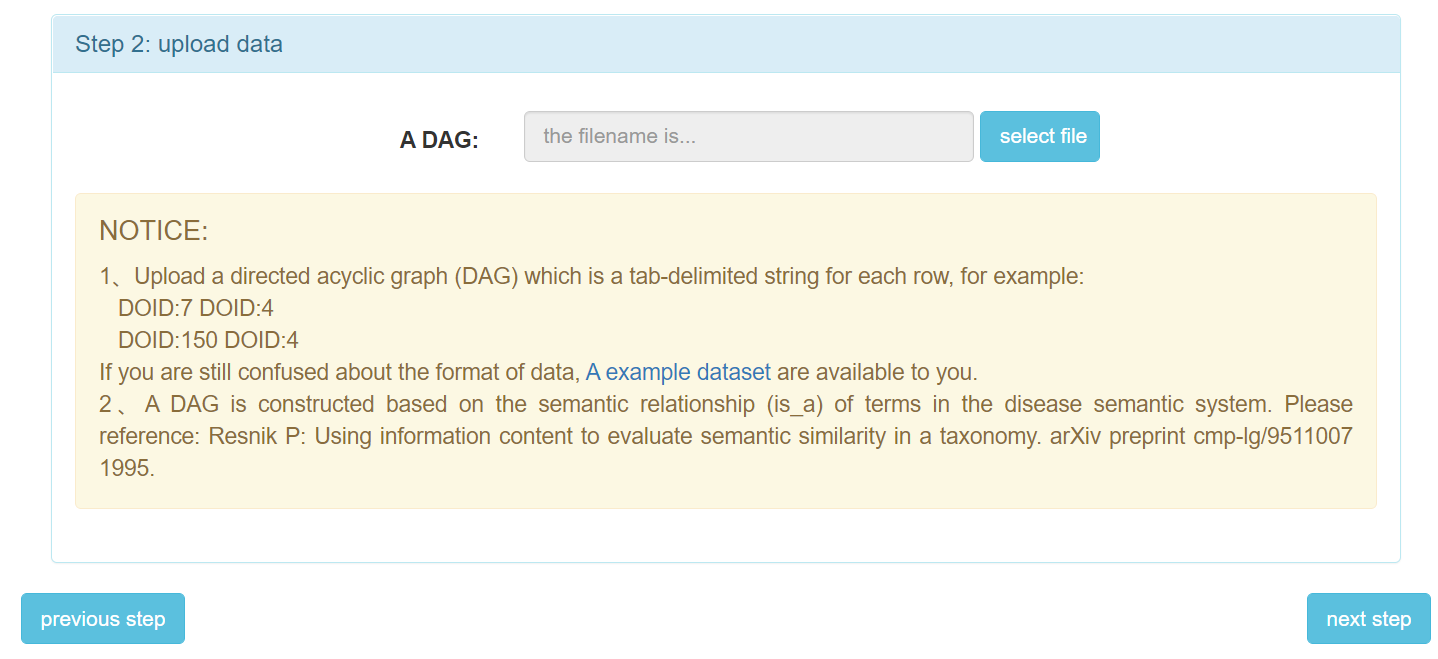
Step 3: The second step is to upload your data files.
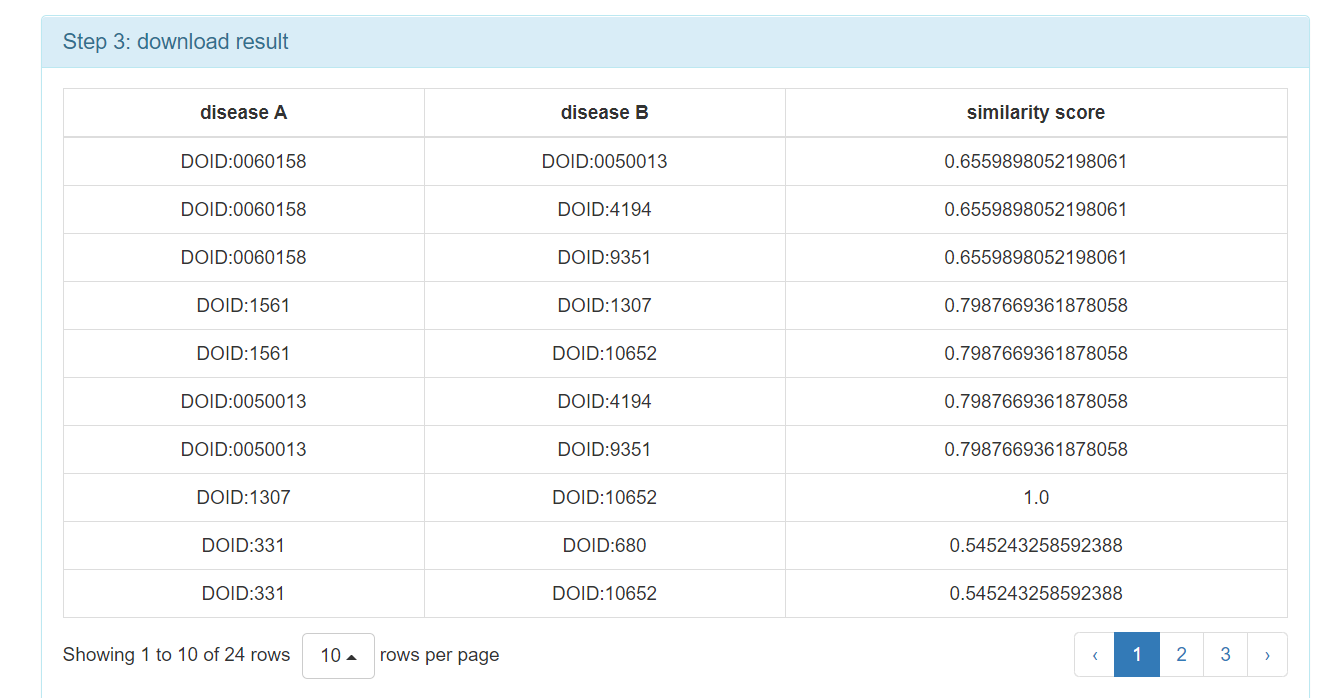
Step 4: Obtain the computational result.
[3] To visualize disease networks
Step 1: Get into "Visualization" page from navigation bar on the top.

In module of "Visualization", DSNet contains two sections: disease heterogeneous network and disease homogeneous network. The section to visualize disease heterogeneous network is firstly introduced.
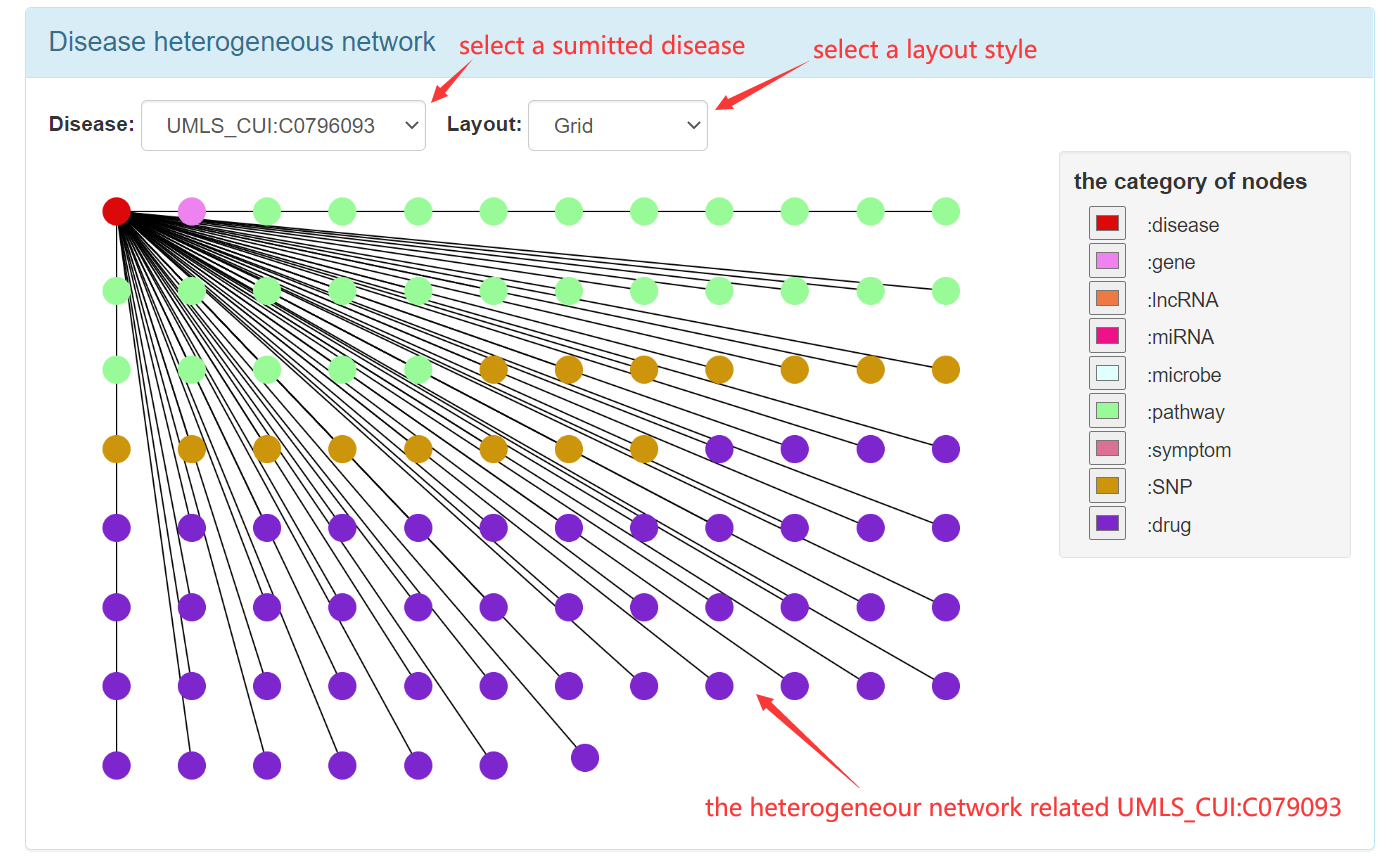
Step 2.1: When get into "disease heterogeneous network" page, the first step is to fill the form with UMLS CUIs.

Step 2.2: The visual result of disease heterogeneous network for single disease.
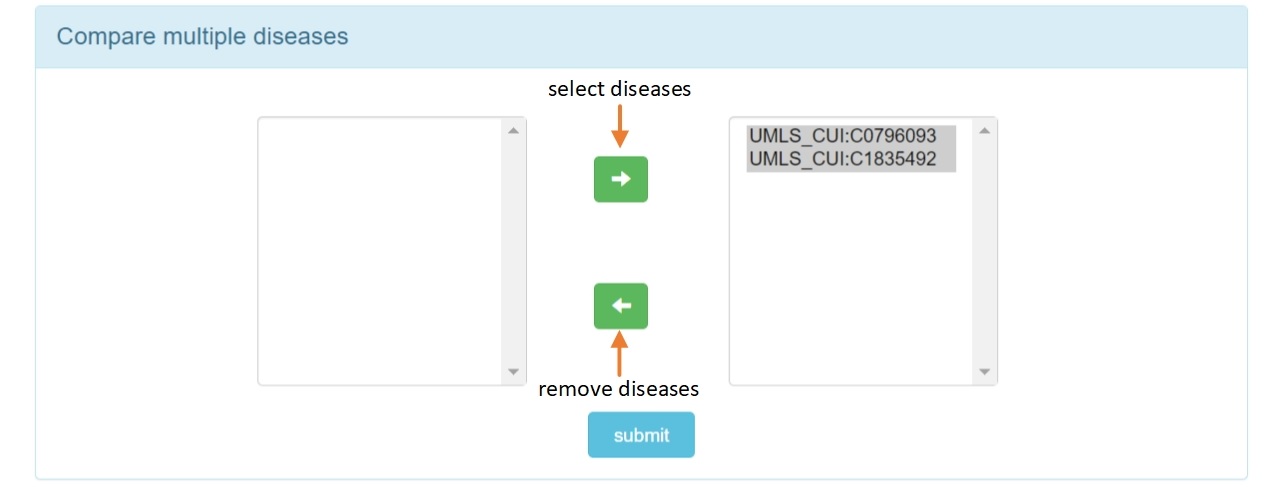
Step 2.4: Select multiple diseases to visualize.
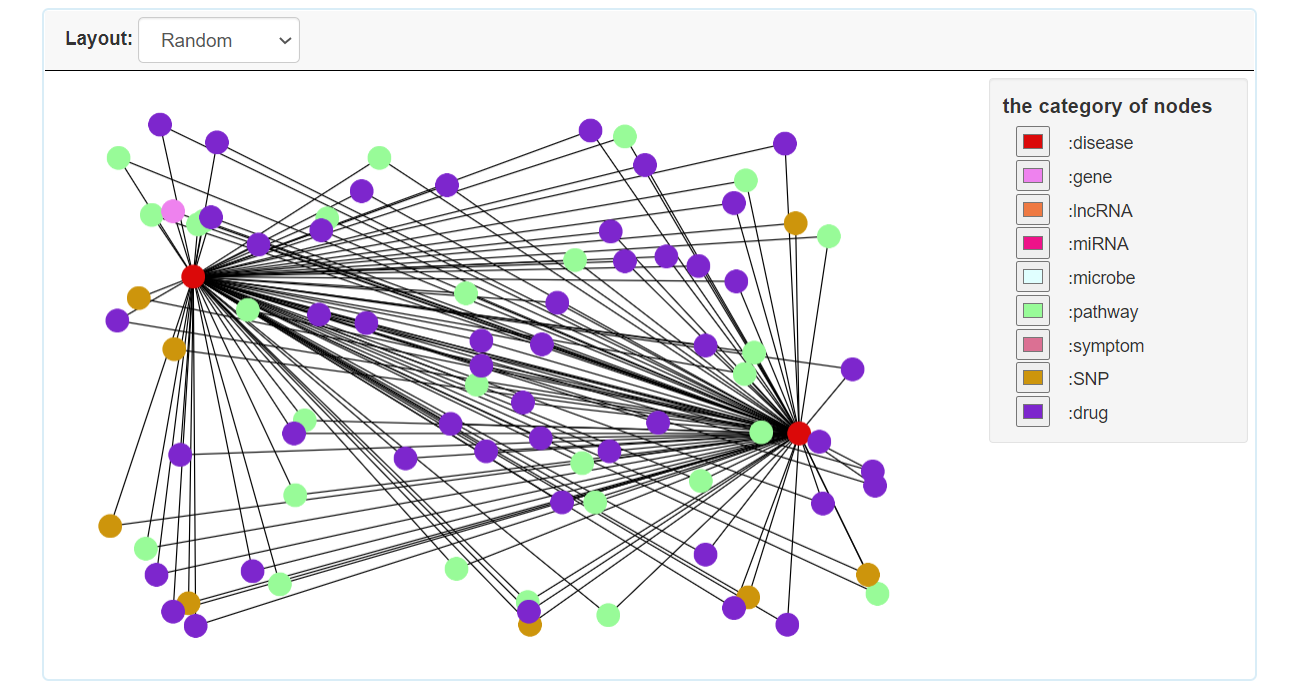
Step 2.5: The visual result of disease heterogeneous network for multiple diseases.
Step 3.1: When get into "disease homogeneous network" page, the first step is to fill the form with the guidance.

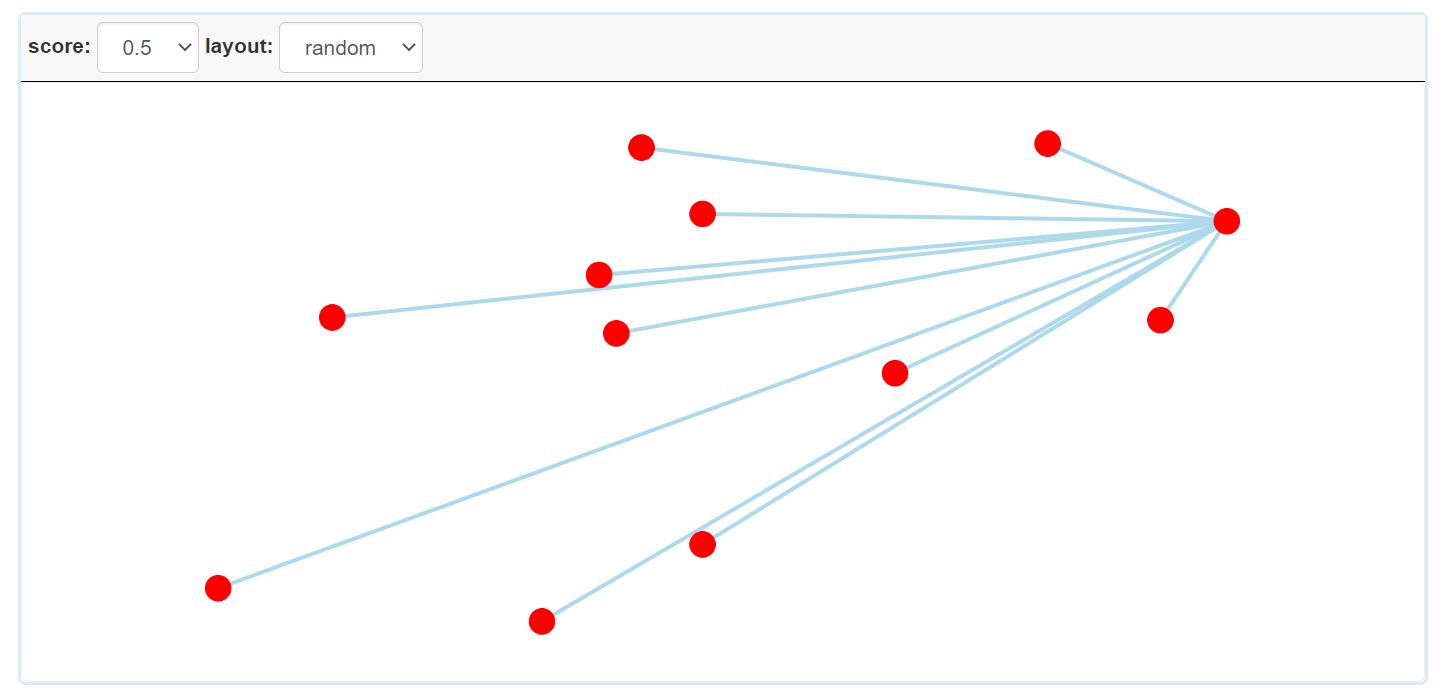
Step 3.2: The visual result of disease homogeneous network for single disease.
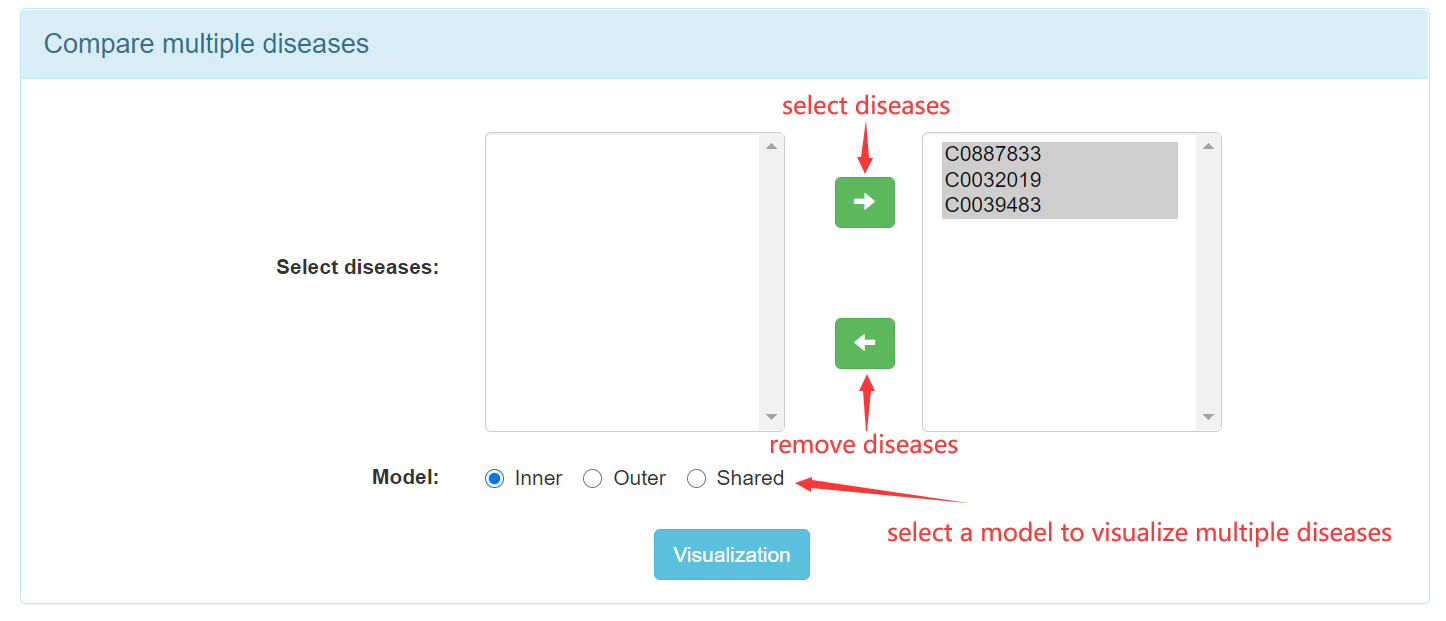
Step 3.4: Select multiple diseases to visualize.
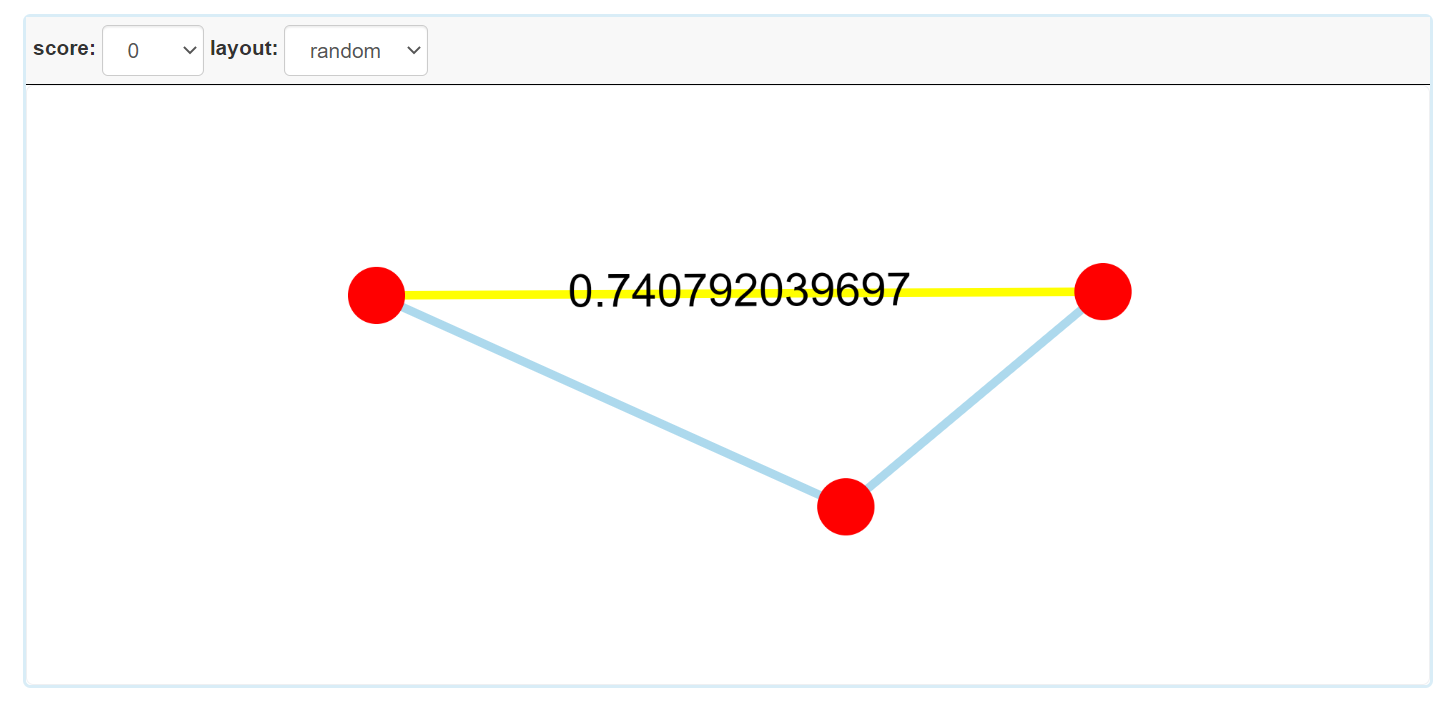
Step 3.5: The visual result of disease homogeneous network for multiple diseases.
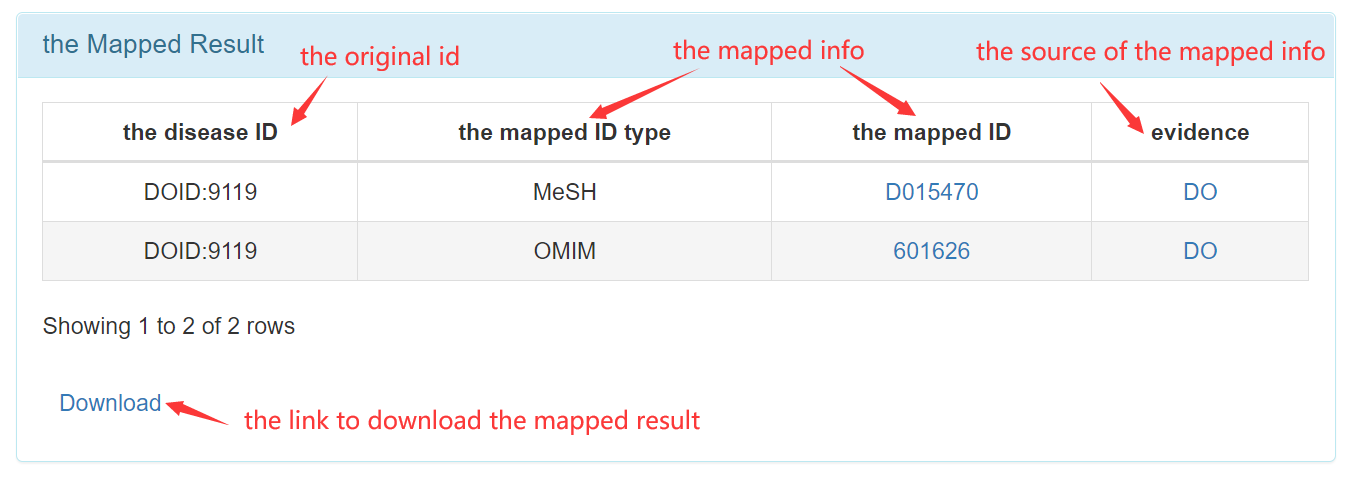
[4] To map disease ids
Step 1: Get into "ID Map" page from navigation bar on the top.

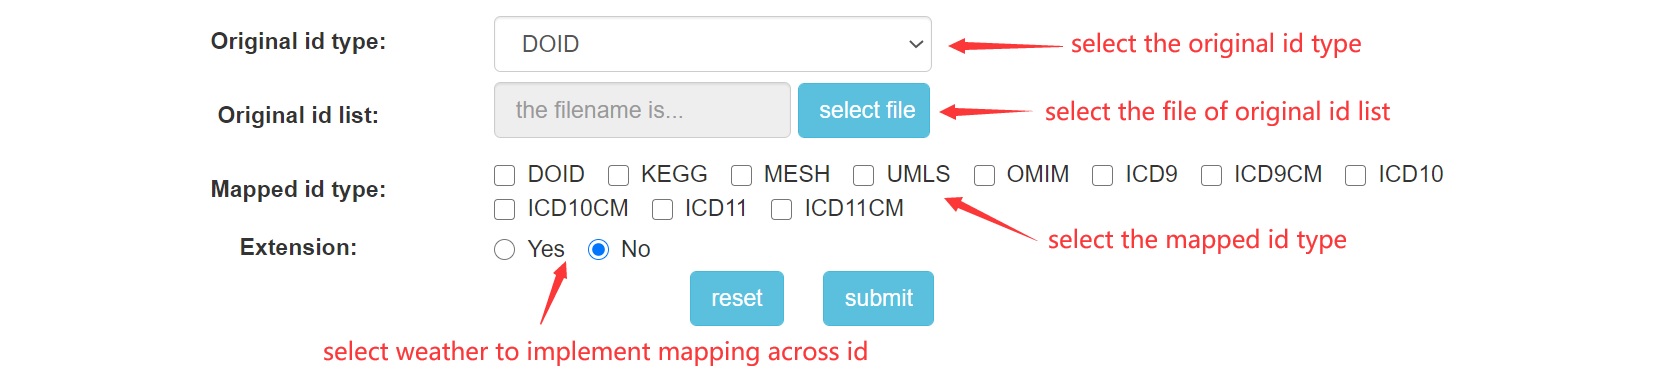
Step 2: Input your file for disease ids and select the necessary options.
Step 3: Obtain the mapped result.